
FlexTraining Management Guide

The FlexTraining Total e-Learning Solution
Management Guide
Version 5.2
Copyright 1998 - 2006 Online Development
Library
Media Library
The Media Library feature lets you establish “Dynamic Messages,” in one of several formats, to be used in your training content where and when you choose. Each message you define may be used as many times as you wish in your authored content and learner interactions.
A Dynamic Message may be a simple JavaScript “Alert” box, a Flash Movie or streaming video that you have created.
It may also be a text message (that you define), which pops up in a separate window. Your Dynamic Message may be small enough to fit in a tiny window or large enough to require a full frame.
View Records
Start by choosing “Media Library” from the Management Center Menu. You may also click on any of the submenu items to see a filtered list of messages.
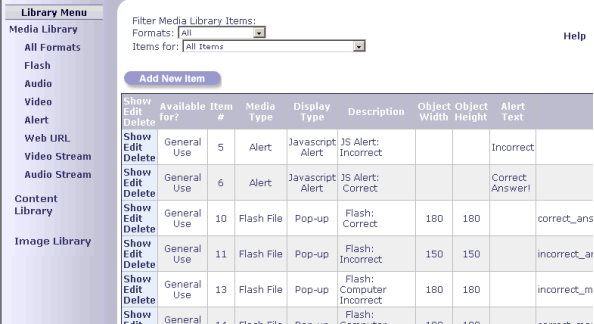
A list view, displaying all currently defined messages, appears in the right frame. The first time you access this screen, before you have added any of your own messages, it will show just the sample messages that ship with the FlexTraining system.
This screen is your gateway to message maintenance, providing Add, Edit and Delete functions, as well as a “Show” link to display the message in a popup window.
You may filter the list based on message type or based on which course the item is assigned, or both at the same time.
Adding a Record
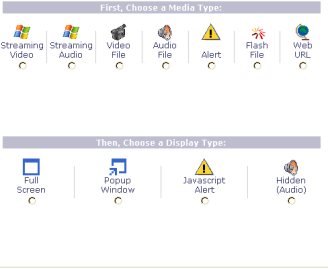
Click on the “Add New Item” button found on the upper right hand corner of the screen. A window will open that contains all available media types.
Complete the fields as follows:
Media Type
Select the media type you wish to use.
Display Type
Select how you would like to have your media displayed. Click the add button to proceed.
Note: Only features available to each corresponding media type will be displayed in the next section (see image on next page).
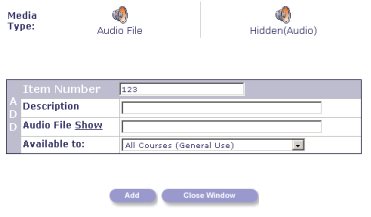
Description
Enter a short, MEANINGFUL description that you will recognize when you go to select messages from a pull-down list later.
Object Height
Enter the height needed for this message. Controls the size of the popup window used to display the message. For Message Type of “Alert,” this parameter is ignored.
Object Width
Enter the width needed for this message. Controls the size of the popup window used to display the message. For Message Type of “Alert,” this parameter is ignored.
Alert Text
What to say in the message.
Flash File
Filename for the SWF flash movie you want to show. Must reside in the “asp/content/Flash_Movies” directory on your server.
Video File URL
Full address (URL) of a streaming video (beginning with “mms://”) to be shown in this message or file relative to the “asp/content/sections/Videos” folder.
Audio File URL
Full address (URL) of a streaming audio to be played with this message or file relative to the “asp/content/sections/Audio” folder. Useful in combination with a text message.
Course
Choose if you would like to make this item specific to a course or allow it to be used by all courses.
When you have completed the form, click the Add button.
Editing a Record
Editing an existing message is done by clicking on the Edit link next to any message. The resulting popup Edit screen is similar to the Add screen except that you do not have an opportunity to change the message number.
In Edit mode, simply enter your changes and click on the Update button. Your changes will be reflected immediately in the List View in the main frame.
Deleting a Record
To delete a message from the Media Library database, click the Delete link next to any message.
If you attempt to delete a message that is referenced in a page you have built with the FlexTraining Authoring Tool, you will not be able to complete the deletion. Instead, you will receive a notice identifying which course and authored page are currently using the message. This helps preserve data integrity and prevent accidental deletions.
Concept: What makes up a message?
For starters, for every message you define, as well as the samples shipped with the FlexTraining system, there is a record in the FlexTraining database.
Beyond that, it depends on what the Message Type is and what fields you complete in your “Add New Record” dialogue. If you want to define the simplest possible message, use the “Alert” media type and simply enter a phrase or sentence in the Alert Text field. You’ll get a JavaScript “Alert” box that pops up any time the message is triggered, and no external files are required.
Another simple message would be the “Pop-up Window” Media Type. A Flash-movie message would have a filename in the Flash File field (a file that you have created and which resides in the asp/content/Flash_Movies directory on the web server). This is a more complex message because it requires an external component (the Flash Movie file), in addition to the message definition in the database.
A streaming video (or audio) clip would also be more complex than a simple “Alert” message, since it requires the URL for a streaming multimedia file (that you have created outside of FlexTraining), and also requires Multimedia server software (Windows Media Server) to deliver the video or audio.
Using Your Records
The Dynamic Messages you can create in this facility are not used unless and until they are referenced elsewhere. The primary use of the Dynamic Messages is in the FlexTraining Authoring Tool (for specific procedures, see the Authoring Tool section of this Management Guide).
However, the messages can also be referenced (and, therefore, integrated into) web-based training content created in other, 3rd-party web authoring tools like Microsoft Front Page and NetObjects Fusion.
The messages can be tied to hot-spots in pages you create to form a very effective interactive point-and-click training technique.
Note: You can also reference these pop-up multimedia messages from any web pages you create to use as training content in an external authoring tool (like Front Page or DreamWeaver)
To utilize the Dynamic Messages in your own pages:
1. Place the following line in the HEAD section of your HTML page
<!--#INCLUDE FILE="popup.htm"-->
This will load all the javaScript needed to open the windows. This assumes your page is being placed in the directory asp/content/sections. If it is in a lower directory, you would include a .”./" in front of the "popup.htm.”
2. Whenever you need to link to a message, use
<A HREF="JavaScript:m1()"> if you want to play your message that you are calling message 1, and
<A HREF="JavaScript:m2()"> to link to a popup window that plays message 2, etc.
That should do it. You can put these HREF tags (links) around text or images the same way you place other links within your HTML page.
We suggest you put your pages in the directory asp/content/sections. If you do not you will also have to edit popup.htm to add some .”./" strings to the URL that refers to the page called "message_popup.asp.”
Define your "Dynamic Messages" using the Management Center menu, and the screen will list your message numbers, so that you can easily refer to them later.
Again, keep your pages in asp/content/sections. You should be in good shape, and this feature should be easy to use.
Content Library
This section allows you to manage your uploaded files as well as to upload new ones.
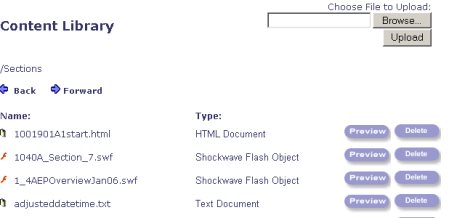
Image Library
This section allows you to upload and manage pictures for use in your authoring tool.
PPT to Flash Converter
Uploads PowerPoint files, then converts them to Flash. (This is only available for FlexTraining Login & Go subscription services or Hosted customers).
Reporting Menu
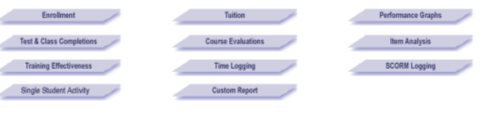
The FlexTraining Management Center Module includes eight (8) “Standard” or pre-defined report formats, and one “Custom” or “Ad-Hoc” format, under the “Reporting & Analysis” Option.
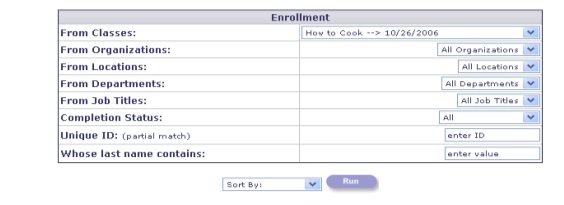
Enrollment
This report contains a listing of all classes offered, all students presently enrolled, class start dates, and instructor names. You can apply "filters" to the records in the database, which will determine which records appear on your report. You may filter by Class and/or by Organization. You can also sort the data by whatever variables are available in the “Sort by” pull-down list.
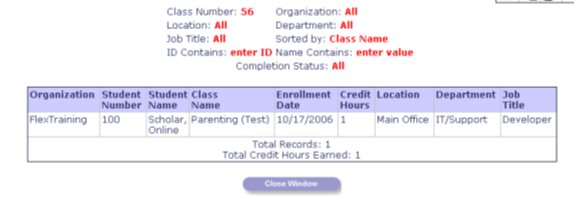
Sample Enrollment Report
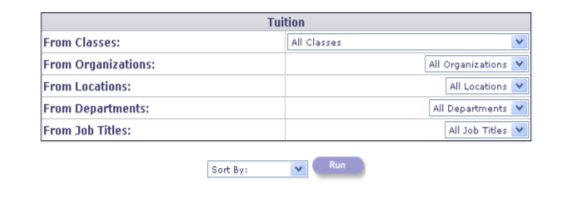
Tuition
This report contains class-by-class enrollment, including tuition totals, if applicable. It also includes tuition totals by Class, Course, or Organization. You can filter by Class and/or by Organization. You can also sort the data by whatever variables are available in the “Sort by” pull-down list.
Performance Graphs
The Performance Graphs feature, found within the “Reporting & Analysis” section, allows you to depict overall performance of your training tests and see how performance stacks up against established targets ("passing scores").
After you select the "Performance Graphs" option from the menu, you are presented with a list of Courses, with pre-filled checkboxes beside each (see image below). Only courses that are currently in the Catalog will appear in the list. Courses, which have been built but not yet scheduled, naturally, do not appear.
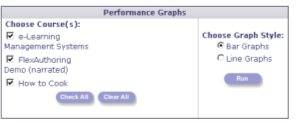
If you do not want to see testing results for all courses in the list, you may "un-check" some of the boxes. You can also specify whether you want to see the graphs in a "Bar" or “Line” format. If there are more than three or four tests in most of your courses, the ”Line Graphs” style may be the best format to choose. Otherwise, the “Bar Graphs” style will probably be the best choice.
After making your selections on this "Options" screen, click on the Graph button to actually create and display the graphs. A typical set of test results graphs may look like the following:
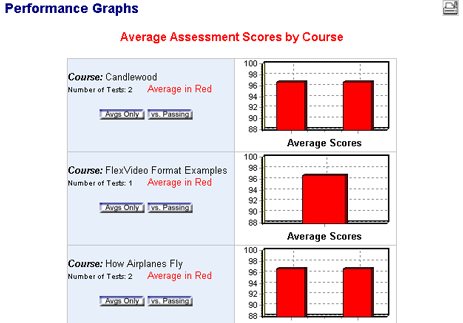
Each graph represents a single course, whether it has been offered every week for a year, or has only been scheduled one time. Each point on the graph represents a single test. Some courses may have many tests, while some may have only one or two.
Note that you can change the "view" from showing average scores only to showing average scores vs. the established passing scores on a test-by-test basis. Roll your mouse over the silver buttons to change which graph is displayed.
If you have a problem generating the graphs, make sure the security permissions for the FlexTraining/asp/content/temp directory are set, which will allow you to write to and create files in the directory. This directory actually stores the dynamically generated graph image files.
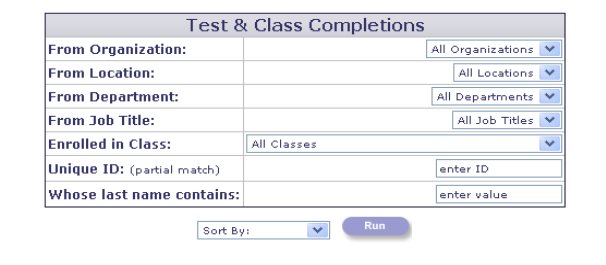
Test & Class Completions
This report contains details of all test attempts and scores, along with all Course completions for a given student. You may also view the actual test(s) taken by each student, if available. The report displays total amount of questions, number correct, % correct, % required to pass the test, test result (pass/fail) and the actual questions the student was required to answer.
You can filter by Organization, Location, Department, Class, Unique ID and/or by a Student’s last name. Note that if you do not recall the Student’s entire last name, you can place as much of the name as you remember in the input box, where it says “enter value.” This will bring up a list of student’s whose last name contains the value you entered. Sort the data by whatever variables are available.
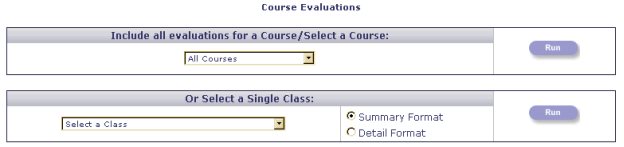
Course Evaluations
This report contains question-by-question Evaluation responses, by “All Courses,” a single “Course” or a single “Class,” in “Summary” or “Detail” format. You can filter by “All Courses,” by one Course or by one Class.
Item Analysis
This report contains the test questions given, available answers, correct answers, number of Learners who took the test, percentage of correct answers given and an answer-by-answer breakdown, by percentages, of all answers given, regardless if the answer was correct or incorrect (by Course and Test you have selected).
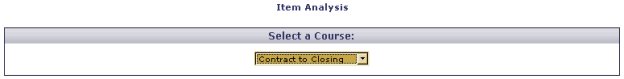
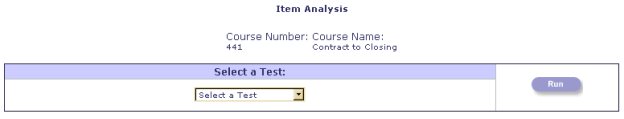
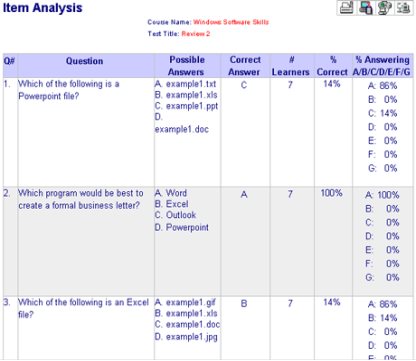
Sample Item Analysis Report
Training Effectiveness
This report displays a comparison between the Learner’s Pre-test and Post-test scores per student, per Course. It is a valuable tool for checking student progress. You can filter by Organization, Location, Class and/or by a Student’s last name. Note that if you do not recall the Student’s entire last name, you can place as much of the name as you remember in the input box, where it says “enter value.” This will bring up a list of student’s whose last name contains the value you entered. Sort the data by whatever variables are available.
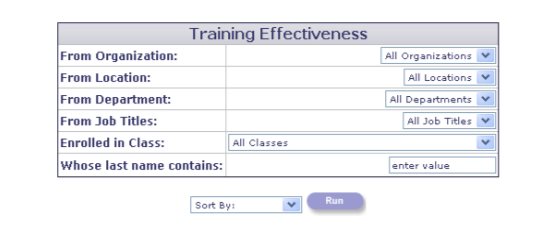
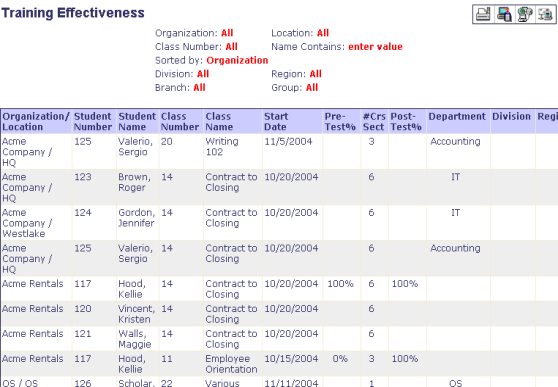
Sample Training Effectiveness Report
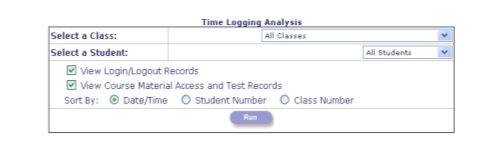
Time Logging
The Time Logging report contains the time it took a student to complete a test. This report may be filtered by “All Classes,” a single Class, “All Students” or an individual student. You may elect to view (or not view) “Login/Logout” records and/or “Course Material Access and Test Records.” Sort this report by Date/Time, Student Number or Class Number.
If you do not find a “Standard” report on this menu that meets your needs, you can build and run an Ad-Hoc or “Custom” report using the Custom Report Builder, as described on the next page.
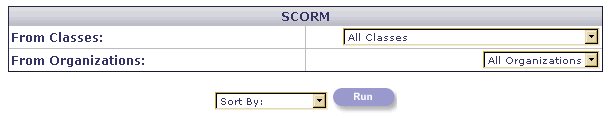
SCORM Log
The SCORM Log Report contains the results from any SCORM-compliant course sections. All other class results are found in the Class & Test Completions report.
Single Student Activity
The Single Student Activity report provides the user with a snapshot of the progress of a particular student or a specified class.
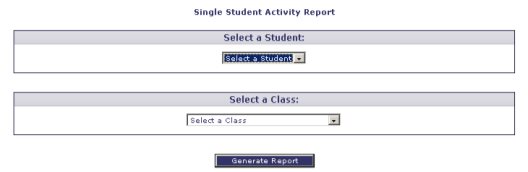
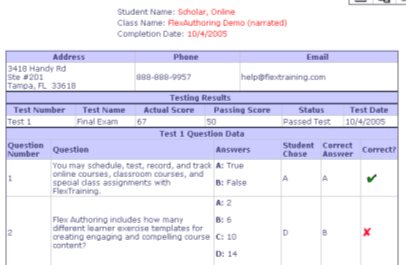
Sample Single Student Activity Report
Custom Report Builder
The FlexTraining Custom Report Builder is a facility that lets you, the administrator, design and run a custom report "on-the-fly.” It lets you query the FlexTraining database and define the information (and display sequence) you wish to see on your report.
Use the Custom Report Builder by performing the following steps:
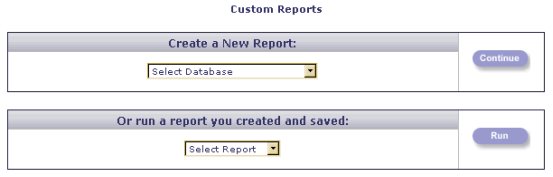
Step 1: Start by selecting a database type or running a saved report.
In the Management Center menu, click on the “Reporting & Analysis” button. Now click on the Custom Report link or image (it is on the upper right-hand corner of the page).To run a new report by database, select a database type. Options are:
- Enrollments and Progress
- Evaluations
- Students
- Test and Course Completions
From the “Select Database” pull-down list, select one of the databases mentioned above, and then click on the “Continue” button. The database selected will determine what fields and sort sequence you may choose from.
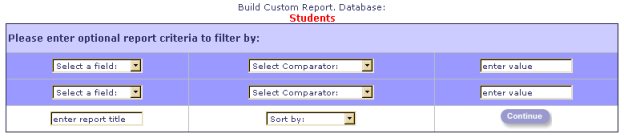
Step 2: Enter Record Selection parameters.
Here is where you apply "filters" to the records in the database, which will determine which records appear on your report. You may enter one or more values on this screen. Only records whose values match the values you enter will be included.
Below is the Record Selection screen as it would look if you selected the “Students" database:
The values you enter will selectively reduce the number of records on the report.
For example, if you selected “Last Name” from the “Select a Field” pull-down list, selected the “Equal to” from the “Select Comparator” pull-down list, and then highlighted and typed “Scholar” in the input box that says “enter a value,” you would only see information for students with that Last Name (refer to the image on previous page for clarification). Note that this screen allows you to select an operator such as "Equal to," "Contains," "Greater Than" and "Less Than" for each field. This feature gives you fine-grained control over exactly which records are selected.
Every field on the Record Selection screen above works in this way.
Step 3: Enter Report Title and Choose a Sort Sequence.
You may give your report a Title by typing the Title you desire in the input box that says “enter report title.”
Sort your data by selecting a field from the “Sort by” pull-down list.
Choose a field to sort the report contents by, and then click on the "Continue" button.
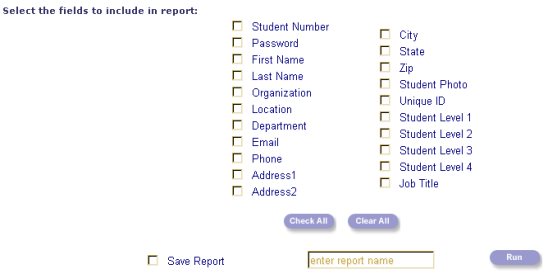
Step 4: Select the fields to be displayed on your report. Save and/or run report.
The Field Selection screen lets you choose the columns to be displayed on your report (refer to the image on the next page for clarification).
You may ask for just a few fields for the report or all fields in the database you selected. Keep in mind that the more fields you request, the wider the report will be. This may be an important consideration if you plan to print the results on paper.
This screen is where you also have the choice of saving the report to a database for accessing it at a later date. To save a report, simply click on the “Save Report” check box and then highlight and type “Demo Report 1” in the “enter report name” input box. Click on the “Run” button to view the report.
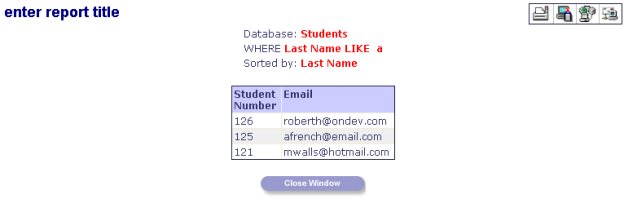
Sample Report
Note the icons at the top right of the report window.
![]()
The first icon, from left to right, is the “Print” icon. Click to print your report. The second is the “Download HTML” icon. Click on the “Download” button to generate and download an HTML version of the report (follow on-screen instructions).
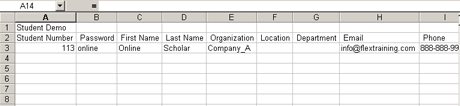
The third is the “Download CSV” icon. Click on the “Download” button to generate and download a comma-delimited version of the report. If a box comes up asking what you’d like to do with this file, choose “Open from current location” and click on “Continue.” Notice that the data is already imported into Excel (refer to image on top of next page). Click on the “X” on the top right-hand corner of the window to close it.
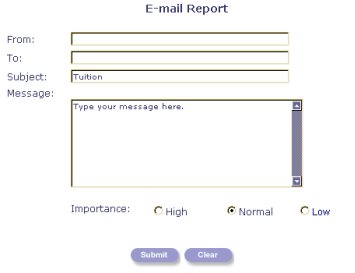
The last one is the “Email” icon. Type in the email address you would like to send your report to and any message you wish to add, and then click on the “Submit” button to email the report (refer to image below). Note that the “From:” and “Subject:” input boxes are pre-filled. If you wish to clear all fields, just click on the “Clear” button.
Click on the “Close” button to close the report window.
![]() FlexTraining Version 5.2 Page 1
FlexTraining Version 5.2 Page 1